


Latest research:When the Circuit Dissolves →12 vIndexes on Hugging Face
Sign up
What Moves a RAG System's Score, and What Doesn't

What Moves a RAG System's Score, and What Doesn't

Two months of retrieval experiments, presented at Cloudflare Connect 2026: fixing coverage was worth 31 points, swapping the whole retrieval stack was worth nothing, and no router we built beat one fixed pipeline.

On 20 October we spoke at Cloudflare Connect at Moscone West in San Francisco. The talk covered two months of retrieval experiments: public benchmarks, a synthetic legal corpus, more than a hundred websites and a live customer deployment. We went in believing that routing each question to the right retrieval method would beat any single method. It did not. Most of what we expected to matter did not, and two things we had not looked at closely mattered a great deal.

The full talk from Cloudflare Connect 2026, Moscone West, San Francisco.

The short version

  1. Whether the answer is in the index matters more than how you search it.
  2. Routing each question to the “right” retrieval method looks powerful in hindsight, but we could not capture that gain in practice.
  3. The best setting depends on the documents. Our own default lost on public benchmarks, and the winner changed again on a legal corpus.
  4. A higher score is not always a better answer. One model swap raised our suite score ten points and changed nothing a visitor would notice.
  5. So measurement has to come first: test on the customer’s own content, against a pass bar set before the run.

Every figure below comes from our research notebooks. Where we have a 95% confidence interval, it sits next to the number in square brackets.

One setup, very different scores

We build a demo assistant for each prospect’s website and score it on that site’s own test questions. Almost every one of those demos runs the same default retrieval setup. The scores are nowhere near the same.
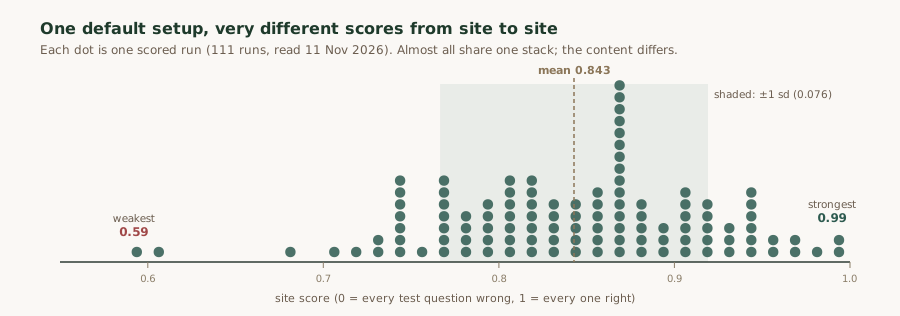
Dot histogram of 111 demo-site QA scores from one default retrieval setup. Scores range from 0.59 to 0.99 with a mean of 0.843 and a standard deviation of 0.076. Most sites fall between 0.75 and 0.93.
Every scored demo run as of 11 November 2026: 111 runs, mean 0.843, from 0.59 to 0.99. The talk showed the same picture at 98 sites (mean 0.844). Repeat runs of one site move by about 4 points, so most of this spread is the content, not noise. It does not show one architecture beating another, because the architecture barely varies.

That spread is the starting point for everything else. If the same system scores 0.59 on one site and 0.99 on another, the first question is what differs about the site.

Fixing coverage beat changing the stack

The largest single gain we have measured came from making sure the needed pages were actually in the index. On sites where the crawl had missed pages, ingesting them raised scores by 31 points. Swapping the entire retrieval stack moved the mean from 84.3% to 84.0%.
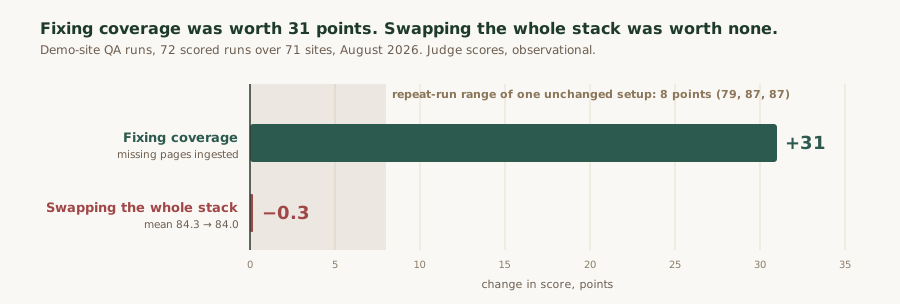
Bar chart. Fixing corpus coverage raised scores by 31 points. Swapping the entire retrieval stack moved the mean from 84.3 to 84.0, a change of minus 0.3 points. One unchanged setup scored 79, 87 and 87 on three repeat runs, a range of 8 points, shown as a shaded band.
The shaded band is noise: one unchanged setup scored 79, 87 and 87 on three repeat runs. The stack swap sits well inside it. The coverage fix is almost four times wider. Observational, from our demo pipeline in August 2026, not a controlled experiment.

A retrieval system cannot return a page it never ingested, and no amount of reranking recovers it. We now check coverage before anything else.

Within one corpus, the setting does matter

None of this means retrieval settings are irrelevant. On a fixed corpus with the answers present, the choice changes the score, and keyword search on its own came last on both public benchmarks we used.
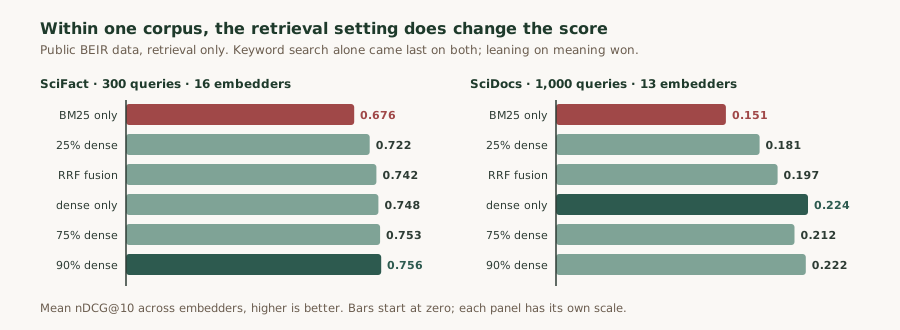
Two bar charts of mean nDCG at 10 by retrieval setting. On SciFact: BM25 only 0.676, 25 percent dense 0.722, RRF fusion 0.742, dense only 0.748, 75 percent dense 0.753, 90 percent dense 0.756. On SciDocs: BM25 only 0.151, 25 percent dense 0.181, RRF fusion 0.197, dense only 0.224, 75 percent dense 0.212, 90 percent dense 0.222. Keyword search alone is last on both.
"Dense" is search by meaning (embeddings); BM25 is search by keyword; the percentages are how far a blend leans toward meaning. On these two science collections, leaning on meaning won. Public BEIR data, retrieval only, averaged over 13 to 16 embedding models.

Our own default weighting lost

That result was uncomfortable, because the hybrid search we shipped was weighted 70% toward keywords. On both benchmarks a weighting of about 5% keyword did better.
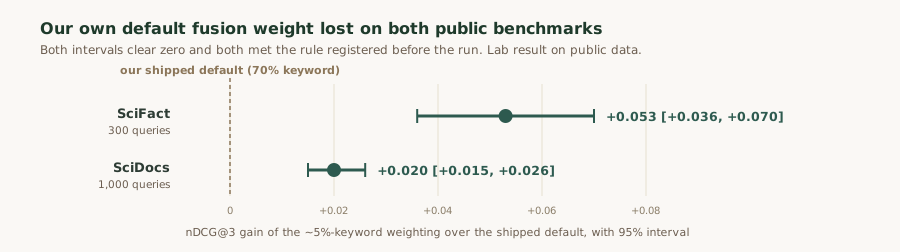
Interval plot of the nDCG at 3 gain from a roughly 5 percent keyword weighting over the shipped 70 percent keyword default. SciFact: plus 0.053, 95 percent interval 0.036 to 0.070. SciDocs: plus 0.020, interval 0.015 to 0.026. Both intervals sit entirely above zero.
SciFact +0.053 [+0.036, +0.070] and SciDocs +0.020 [+0.015, +0.026] nDCG@3. Both met the rule we registered before the run. This is a lab result on public data; making the weight a per-release setting chosen by A/B test is planned, not shipped.

Then we ran the same seven settings on a different kind of document: a synthetic law-firm corpus of 9,288 files with 242 retrieval tasks. The setting that won on science fell to sixth. An equal weighting of keyword and meaning came first.
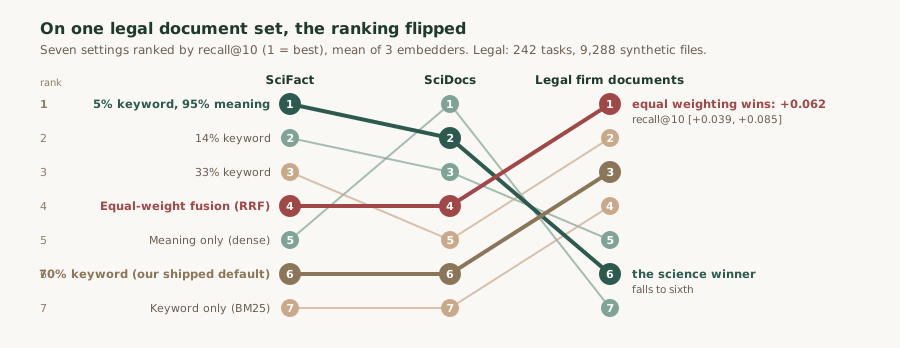
Rank chart of seven retrieval settings across three document collections, ranked by recall at 10. The 5 percent keyword setting ranks first on SciFact and second on SciDocs but sixth on a legal firm document set. Equal-weight fusion ranks fourth on both science sets and first on the legal set. The shipped 70 percent keyword default ranks sixth on both science sets and third on the legal set. Keyword-only search ranks last on science and fourth on legal.
Equal-weight fusion beat the 5%-keyword setting by +0.062 [+0.039, +0.085] recall@10, which met the outcome we registered in advance. Note the gold line: the 70%-keyword default that lost on science ranks third here. One collection is one data point, not a rule. Two of three embedding models showed the flip and the strongest did not clear our margin; the documents are synthetic (Harvey Labs, MIT licence); and even the best setting found only about half of what the documents made findable.

So “which weighting is best” has no single answer. It depends on the documents, which is the argument for testing on each customer’s own corpus instead of shipping one global default.

Per-question routing: a large ceiling we could not reach

If the best method varies, the obvious next step is a router that picks the method per question. On 150 held-out questions from a live customer deployment, two retrieval backends disagreed on 35 of them.
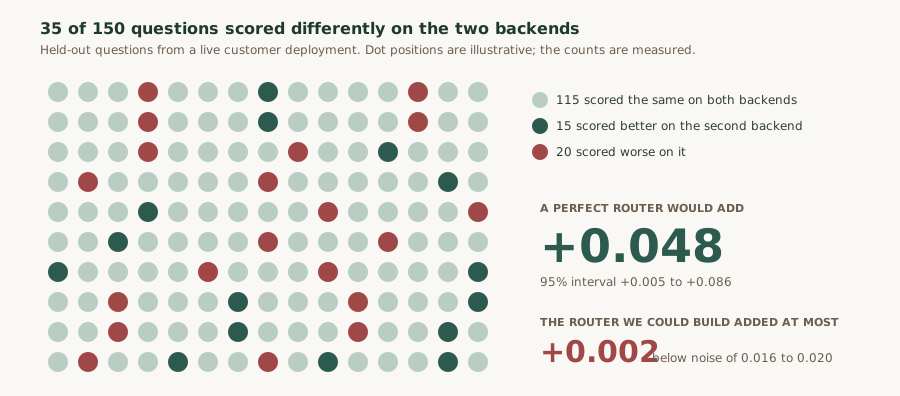
Grid of 150 dots, one per held-out question. 115 scored the same on two retrieval backends, 15 scored better on the second and 20 scored worse. A perfect router choosing with hindsight would add 0.048 to the score, with a 95 percent interval of 0.005 to 0.086. The router that could actually be built added at most 0.002, below run-to-run noise of 0.016 to 0.020.
A perfect router, choosing with hindsight, would gain +0.048 [+0.005, +0.086]. That number is a ceiling, not a result. The router we could actually build, at the threshold we registered in advance, reached about 3% of questions and gained at most +0.002, below the run-to-run noise.

We did not stop at one attempt. Across eight routing experiments and more than 23 router configurations, on the customer set, public benchmarks, the legal corpus and one website, none beat the best fixed pipeline on held-out data. The best-looking gain, +0.051, shrank to +0.030 [−0.023, +0.074] against a plain baseline, an interval that includes zero.
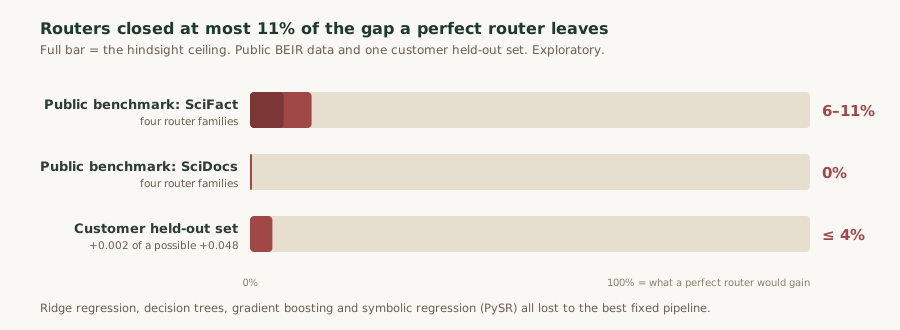
Bar chart of the share of a perfect router's gain that real routers captured. On SciFact, 6 to 11 percent. On SciDocs, zero. On the customer held-out set, at most 4 percent. Ridge regression, decision trees, gradient boosting and symbolic regression all lost to the best fixed pipeline.
Each full bar is what a perfect router would gain; the red is what real routers captured. Four router families, from ridge regression to symbolic regression, closed at most 11% of the gap. The experiment and configuration counts are lower bounds taken from our repository.

The practical reading: pick a good fixed setting for the corpus and spend the effort on coverage.

A score is not an answer

One more result changed how we read our own numbers. We swapped the answering model on 28 sites, keeping the index and the judge fixed. The suite score rose about ten points. Then we asked ordinary visitor questions on two of those sites, and the two models did the same.
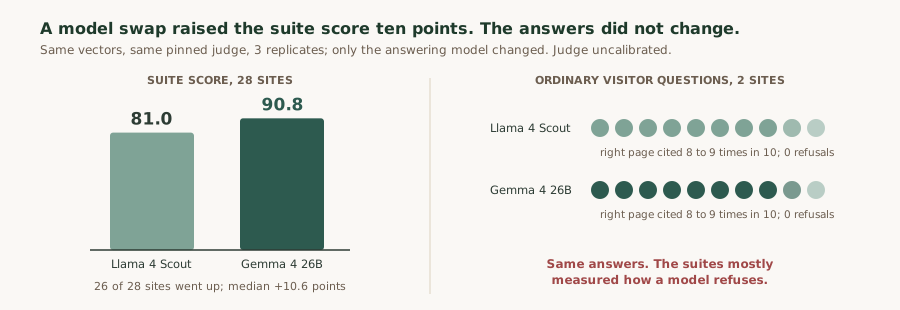
Two panels. Left: swapping the answering model from Llama 4 Scout to Gemma 4 26B raised the mean QA suite score across 28 sites from 81.0 to 90.8; 26 of 28 sites went up and the median change was plus 10.6 points. Right: on ordinary visitor questions on two sites, both models cited the right page 8 to 9 times in 10 and neither refused.
Mean suite score 81.0 to 90.8 across 28 sites, with 26 going up. On plain visitor questions both models cited the right page 8 to 9 times in 10 and neither refused. The lift came mostly from the boundary tests in each suite, which measure how a model declines a question. Judge scores are uncalibrated; the ordinary-question check is two sites with ten questions each.

Before trusting a score, check what the test suite is measuring.

Seeing a corpus

Part of why the corpus dominates is that corpora have very different shapes. Plotting one makes that visible. This is a sample of the SciFact collection, one dot per abstract.
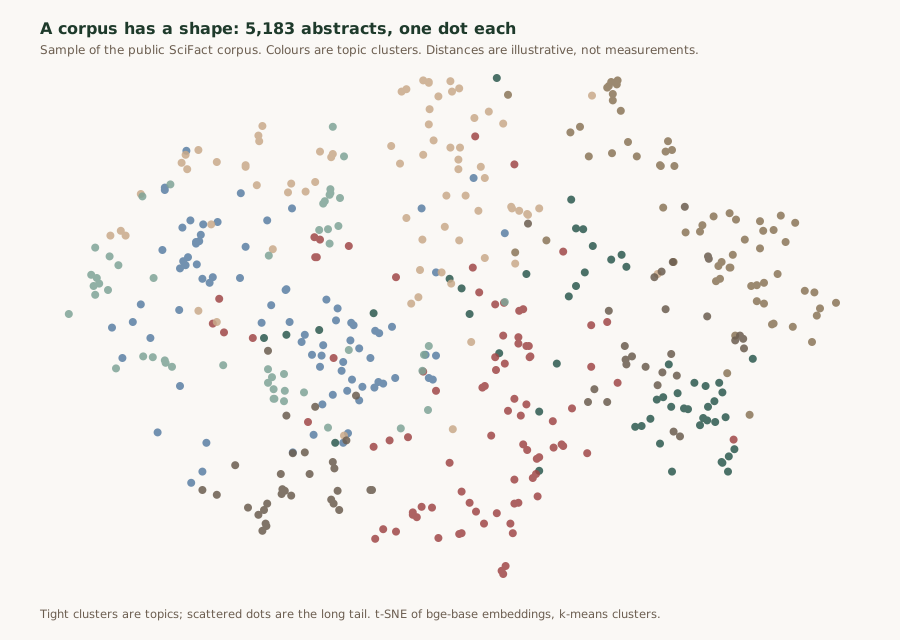
Scatter map of a sample of 650 of the 5,183 abstracts in the public SciFact corpus, one dot per abstract, coloured by seven topic clusters. Some clusters are tight and others are scattered across the map.
Tight clusters are topics and scattered dots are the long tail. The same view of a customer corpus shows gaps, duplicates and pages that crowd out the right ones as shapes. The projection distorts distances, so it illustrates and never proves.

Five checks before trusting a RAG architecture claim

Each check comes from one of the findings above. They are also how we now run QA for customers.

  1. Check coverage first: is the answer in the index at all?
  2. Measure on your own content, comparing setups on the same questions.
  3. Write down the pass bar before you look at the scores.
  4. Report by site and by question type, with the noise next to every number.
  5. Treat a hindsight “oracle” as a ceiling, never as a result.

Short videos

Each finding has a two-minute video:

Three more, on the website spread, the legal flip and the five checks, come out on our YouTube channel between 12 and 14 November.

What these results are not

The answer scores come from an AI judge we have not yet calibrated against human raters, and the results are exploratory. None of them is a signed TrustBench result. When a finding here becomes one, it will be on the public leaderboards with a manifest anyone can verify.

Ready to Build Your Custom AI Solution?

Discover how Divinci AI can help you implement RAG systems, automate quality assurance, and streamline your AI development process.

Get Started Today